Asking a simple question of company data still takes far too long at most firms. The number lives in a warehouse. The person who wants it cannot query that warehouse. So the question becomes a ticket, the ticket becomes a wait, and the answer arrives after the meeting it was meant for has already happened.
Claude Data is Anthropic attacking that wait. It connects to the warehouse or the customer system where the numbers already sit, takes a question in plain words, and returns a dashboard you can open, check and share. On November 10, 2026, it became generally available, and it arrived with a larger job than dashboards alone. It now drafts the story and the narrated video that explain the numbers, not just the chart that shows them.
Claude Data
Official siteA data tool inside Claude that turns connected company data into dashboards, written data stories and narrated videos. Primary use case: quick questions a team would otherwise queue for an analyst, such as how this week signups compare with last month, answered from the live source with the query on show for every chart.
Key features: a plain question becomes a dashboard that stays current as the source data changes; every chart shows its query and when its data was last refreshed; data stories and narrated videos drafted from your metrics for review before sharing; certified queries a data team approves, with a certified badge on charts built from them, in beta; live sharing of current numbers to colleagues without source access, also in beta; caching with a refresh schedule per dashboard; design system support; and tracked changes with rollback.
Advantages: the query behind each number stays visible, so a reader can check what a chart counts instead of trusting it; the tool works beside the analytics stack a firm already runs rather than asking for a move; and one prompt can end as a chart, a story or a short video. Limitations: it needs a connected warehouse or customer system before it can do anything; its two trust features, certified queries and live sharing, are still in beta; and Anthropic itself positions dashboards for quick questions, with deeper analysis sent on to partner tools.
What it is, exactly
Claude Data began life as Claude Dashboards. Anthropic launched Dashboards in beta in October 2026, in the same release as Claude Motion, with a simple promise. Connect a data platform, ask a question, and Claude builds the dashboard and keeps it current.
The rename tells you what changed in the month since. Anthropic says it changed the name because the way companies use their data is broader than dashboards, and the product now covers how they work more broadly. Read that as a scope claim you can test against the feature list. The dashboard is still the centre. Around it now sit the story formats, the certification system, the sharing system and the housekeeping that a tool needs once a whole firm, not one curious analyst, starts to depend on it.
Old dashboards keep working under the new name. Nothing in the launch asks a team to rebuild what it made in beta. That continuity matters, because the sibling tools launched beside it, Claude Sheets and Claude Whiteboards, are still in beta, while Data is the one member of the new office family that Anthropic now calls finished enough for general use.
How a dashboard gets built
The flow has three steps, and the middle one is the part worth watching. First, you connect a source. Anthropic names Amazon Redshift, BigQuery and ClickHouse in the November launch, and its October launch added Databricks and Snowflake, plus customer systems such as Salesforce through connectors. Second, you ask the question in plain words, the way you would ask a person. Third, Claude writes the query for each chart, runs it against your source, and builds the dashboard.
A query is the instruction that pulls numbers from a database, written in SQL, the standard language for that job. Claude Data does not hide that instruction. Click any number and you see the query behind it, or ask Claude to explain it. Each chart also shows when its data was last refreshed. Those two details sound small. Together they are the difference between a chart you can defend in a room and a chart you have to take on faith, and they are the strongest design choice in the product.
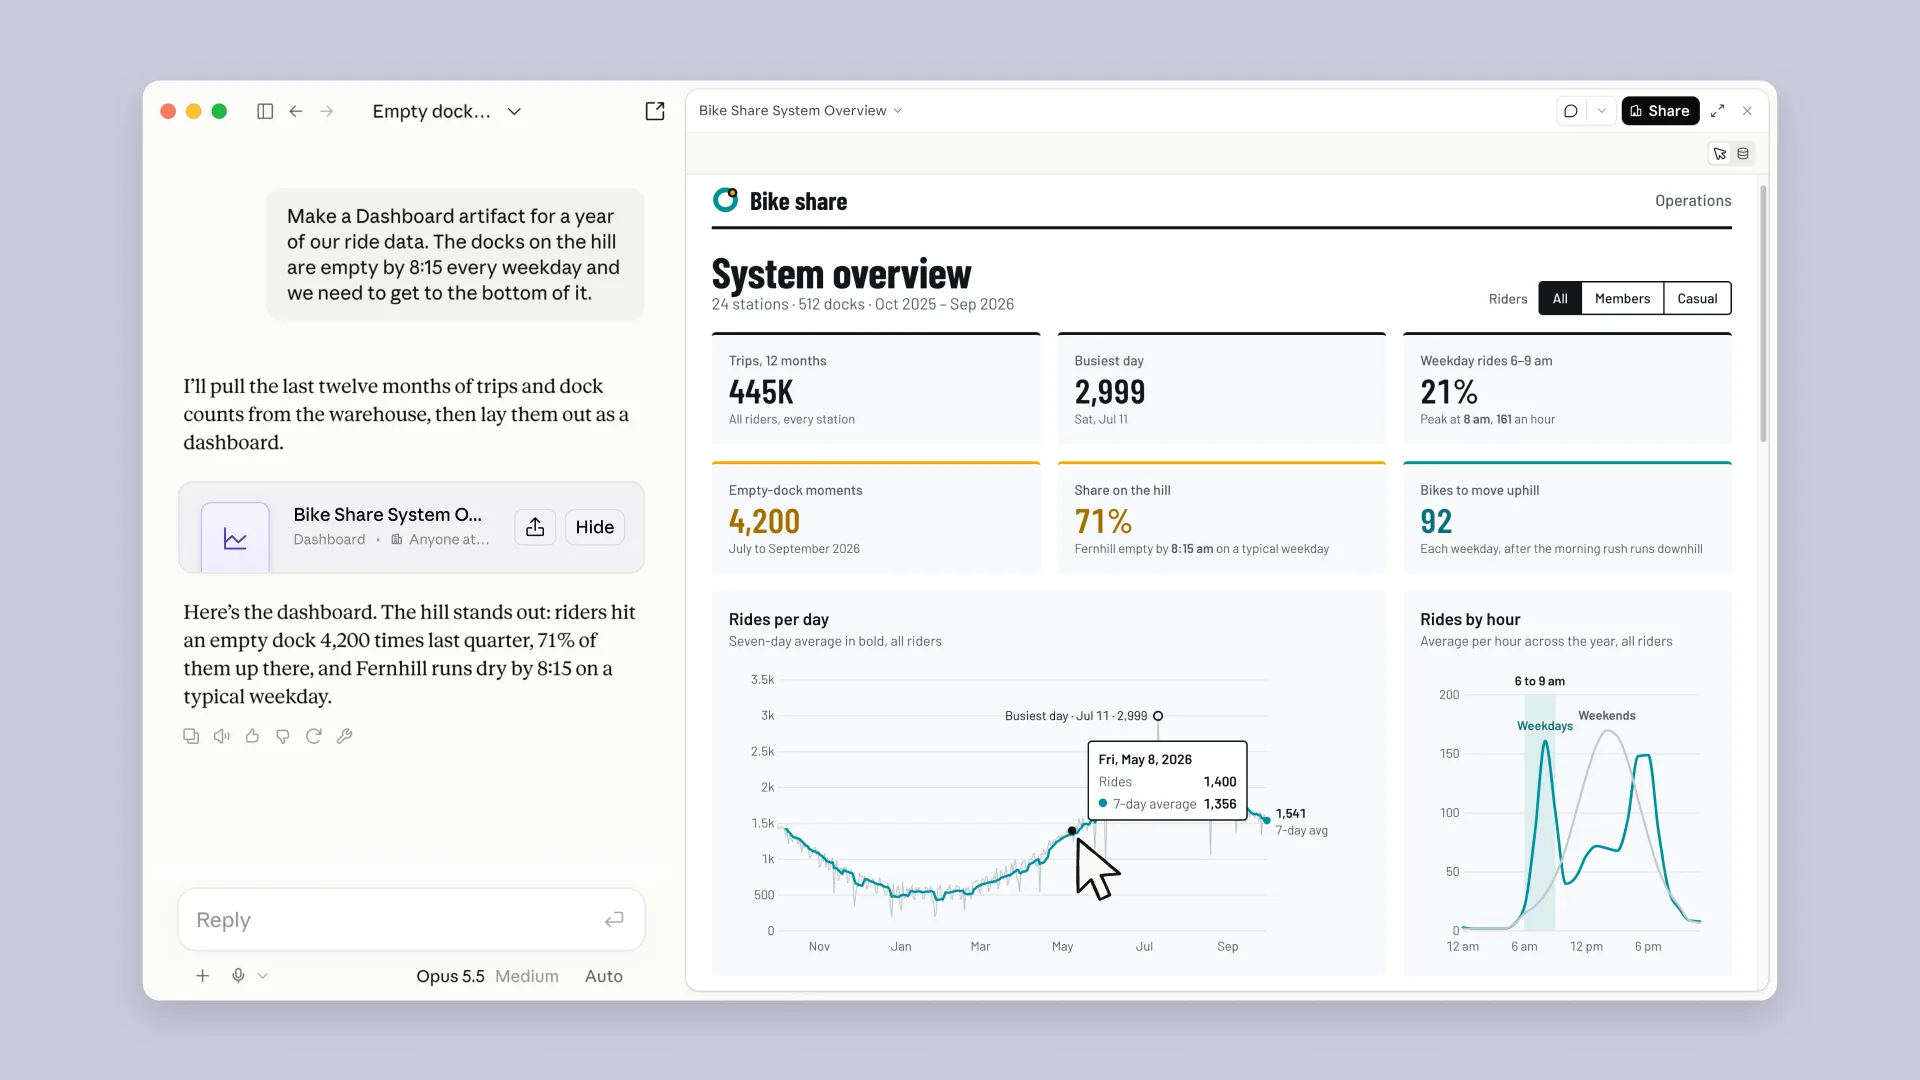 Ask, and the dashboard arrives with its workings on show. Each chart carries the query behind it and a refresh time. Screenshot: Anthropic
Anthropic is plain about the depth this suits. Dashboards work well for quick questions that explore data, in its own October wording. When a question needs deeper analysis, the October launch sends the dashboard on to tools such as Amplitude, Grafana, Hex, Mixpanel, Omni, Perplexity, PostHog or Sigma, with more named as coming later. Data is a front door to the numbers, not a replacement for the analytics team, and the maker says so itself. That honesty should shape how a buyer judges it.
Three outputs from the same numbers
The rename earns its keep here. One connected source and one question can now end in three shapes, and each shape suits a different reader.
| Output | What you get | The job it suits |
|---|---|---|
| Dashboard | A set of charts built from your source, kept current as the data changes, with the query and the refresh time on every chart | A quick question a team asks again and again |
| Data story | A written story drafted with Claude from your metrics, reviewed by you before anyone else sees it | A reader who needs the meaning, not the grid |
| Narrated video | A short video with narration, drafted from your metrics and reviewed before sharing | A wider audience that will watch but will not open a dashboard |
The story and video rows carry the headline, so read them with care. Claude drafts. You review before sharing. Nothing in the launch sends a narrated video of your company numbers out of the door on its own, and that order is the correct one. A wrong chart is an error. A wrong story, told in a confident voice over your own metrics, is an error with an audience. The draft step is not friction. It is the feature that makes the format usable at all.
Certified queries and live sharing
Two additions aim at the oldest problem in company data. Two teams ask what sounds like the same question, use two different queries, and produce two different revenue numbers. Then the meeting becomes an argument about arithmetic instead of a decision.
Certified queries attack that at the source. Your data team certifies the queries everyone should use, so people stop building dashboards on conflicting definitions. A chart built on a certified query carries a certified badge, and a reader can see at a glance which numbers rest on the approved definition and which ones someone improvised that morning. Live sharing attacks the access problem at the other end. A colleague opens a shared dashboard and sees current numbers, even without access to the connector that keeps the data current. Viewers see the results of the queries you approved. They cannot run other queries with your access.
 One approved definition, stamped once, used by everyone. The queue of rival charts is the problem the badge exists to end. Illustration: Dirty Static
The quiet upgrades
Three changes arrived with the rename and will matter more in daily use than the video format will. Caching means a dashboard no longer reloads in full every time someone opens it. Anthropic says dashboards now support caching, and a refresh schedule can be set for each dashboard, so a board the chief executive opens every morning can load fast and refresh on a rhythm its owner chose, rather than on every visit.
Design system support means a dashboard can match the look your company already uses, instead of arriving in a default style that marks it as a draft from a chat window. Tracked changes mean you can see who edited a dashboard and roll back to an earlier version when an edit makes things worse. None of the three will sell a subscription. All three are the kind of detail a tool needs before a firm lets it carry numbers that decisions depend on, and their presence says more about where Anthropic wants this product to live than any launch line does.
Anthropic names Amplitude, Mixpanel, Omni, PostHog and Sigma as partners for Claude Data. That list is shorter than the export list in the October launch, and the two lists do different jobs. Partners are the tools Claude Data works with as part of this release. The longer October list names where a dashboard can be sent when a question outgrows a quick answer. A buyer with a stack outside both lists should ask, before rollout, how a dashboard leaves Claude and what survives the trip.
What it costs, and who controls it
There is no separate price for Claude Data. It is included on all paid Claude plans, and the pricing page checked on November 11, 2026, lists it as a Pro feature that higher plans inherit. The bill is the plan itself, and plan use draws on the shared usage limits for that plan, so a heavy dashboard habit spends from the same pool as the rest of your Claude work.
| Plan | Price, before tax, checked November 11, 2026 |
|---|---|
| Pro | $20 a month, or $17 a month billed annually at $200 paid in advance |
| Max | $100 a month |
| Ultra | $200 a month |
| Enterprise | $20 per seat per month, billed annually, plus usage at API rates |
Control sits with admins, and the defaults split by plan in a way an admin should read before staff find the tool on their own. On Team plans, Claude Data is on by default, along with Sheets and Whiteboards. On Enterprise plans, Sheets and Whiteboards are off by default, and Claude Data turns on by default on November 19, 2026. Owners can change any of this in Organization settings, under Artifacts. That November 19 date is a deadline in disguise. An Enterprise owner who wants a deliberate rollout, with certified queries defined before the first dashboard spreads, has about a week from launch to set that order up.
The tool also lives inside a wider office push. Data, Sheets and Whiteboards work on web, desktop and mobile, and Anthropic says context can move between them, so work that starts on a board can end in a dashboard without anyone restating the brief. Our review of Sheets and Whiteboards found that suite promising and small in its first form. Data is the more finished sibling, and the one most likely to earn its place first, because it starts from data a firm already trusts rather than asking the firm to move its work.
What Works
- Every chart shows its query and its refresh time, so numbers can be checked instead of trusted
- One question can end as a dashboard, a written story or a narrated video, each drafted for review before sharing
- Certified queries give a data team one approved definition, with a badge readers can see
- Caching, a refresh schedule per dashboard, design system support and tracked changes with rollback
What Does Not
- Needs a connected warehouse or customer system before it can do anything at all
- Certified queries and live sharing, the two trust features, are still in beta
- Built for quick questions by the maker own account, with deeper analysis sent to partner tools
- Enterprise use turns on by default on November 19, 2026, whether an owner planned the rollout or not
Which should you choose
Choose Claude Data if your team asks the same quick questions of a warehouse again and again. How this week compares with last month, which region moved, where signups dipped. That is the exact shape Anthropic built and describes. You get the answer as a chart with its workings on show, in minutes, without a ticket queue, and you can turn the same numbers into a story for the people who will never open the chart.
Choose it, with the beta label in mind, if conflicting numbers are your real pain. Certified queries are the most valuable idea in this release for a firm where two dashboards disagree. Pilot them with your data team now, while the feature is in beta, and judge the pilot on one test. Do the rival numbers in your Monday meeting converge on the certified ones, or does the badge become one more thing people ignore?
Keep your current analytics stack for the deep work. Anthropic itself sends harder questions on to Amplitude, Grafana, Hex, Omni, Sigma and the rest. A team that lives in a dedicated analytics tool should treat Data as a fast front door for casual questions, not as a migration. Readers who connect data through an MCP server instead may find the shape of Zoho Analytics and its MCP server closer to their stack.
Wait if you have no warehouse or customer system to connect. The condition is absolute in the launch material, and no plan tier removes it. A small team whose numbers live in spreadsheets should start with Sheets, accept its stated limits, and come back to Data when the numbers have a real home.
Final thoughts
Claude Data is a rename that tells the truth for once. The product did outgrow the dashboard, and the new name follows the work instead of leading it. The story and video formats will draw the attention, but the release will stand or fall on the duller machinery underneath them. A visible query on every chart, one certified definition for the numbers a firm argues about, and a sharing mode that shows results without handing over the keys.
That machinery is also where the unfinished work sits. The two features a careful firm needs most are the two still wearing a beta label, and the Enterprise switch flips itself on November 19 whether anyone planned for it or not. Adopt the dashboard now for the quick questions it plainly handles well. Make Anthropic finish the trust layer before you let its stories speak for your numbers to a wide audience.
Sources
- General availability as Claude Data, the rename reason, certified queries, data stories and narrated videos, live sharing, caching, tracked changes, partners and admin defaults: Claude Whiteboards, Claude Sheets, and Claude Data, Anthropic, November 10, 2026
- The original Dashboards launch, sources, query and refresh display, quick question framing and the tools a dashboard can be sent to: Build live dashboards and animate explainers with Claude, Anthropic, October 8, 2026
- Plan prices, Claude Data listed on Pro, and the Enterprise seat plus usage model: Plans and pricing, Anthropic
- Dashboard screenshot: Anthropic, from the October 8, 2026 launch article
- Other illustrations: Dirty Static, generated in house style
END OF TRANSMISSION
Stay curious. Question everything.